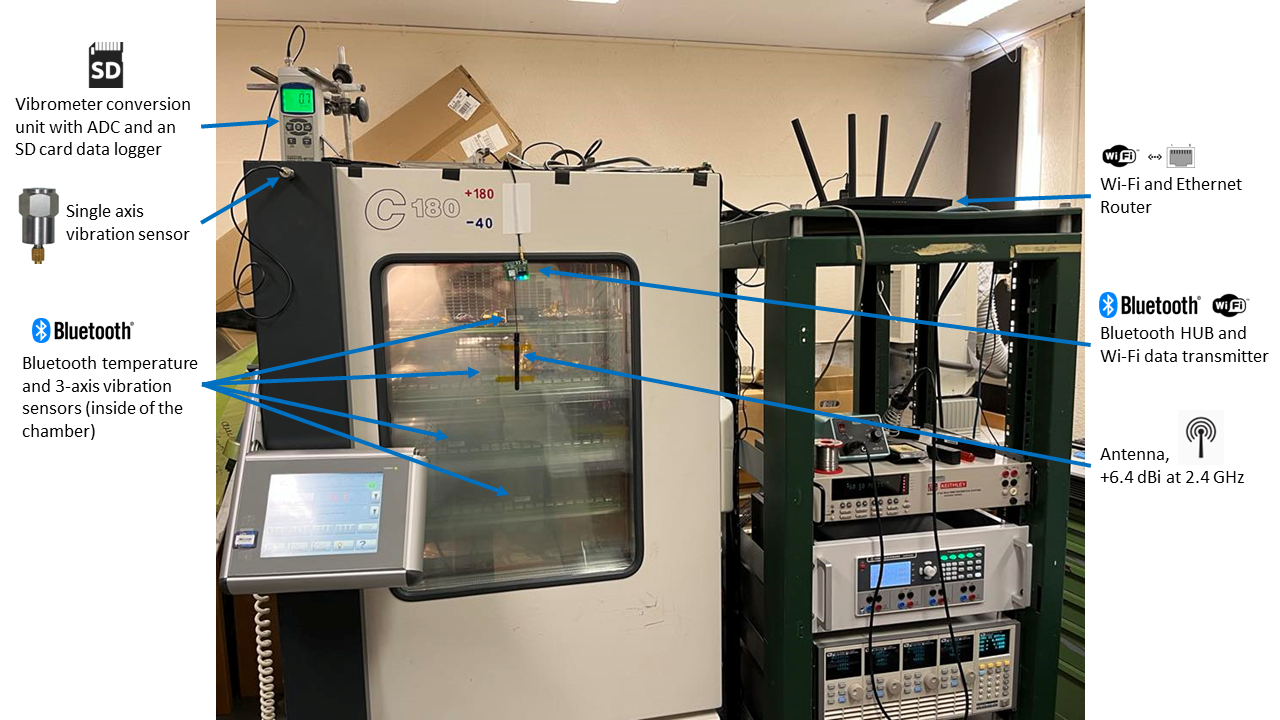
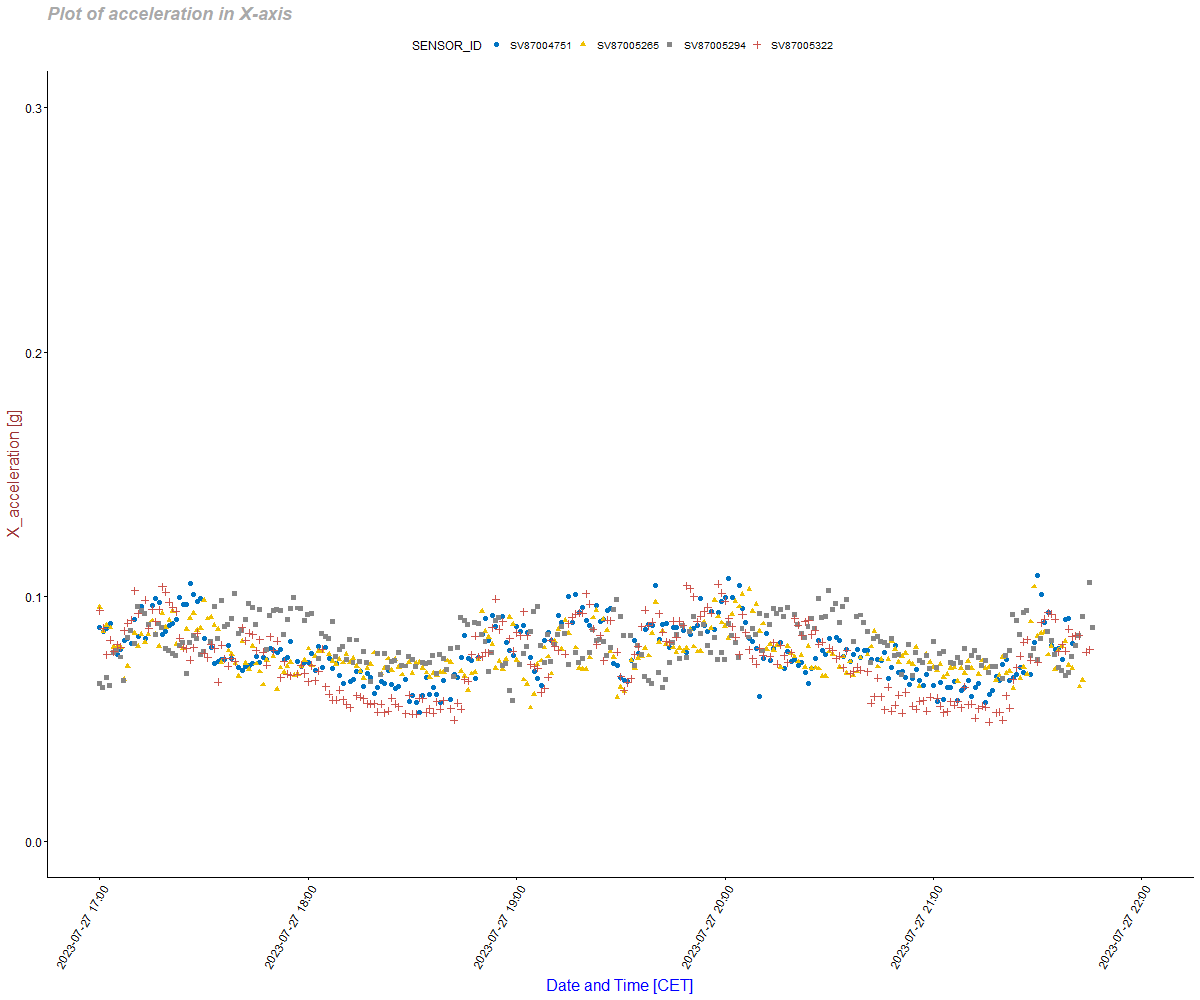
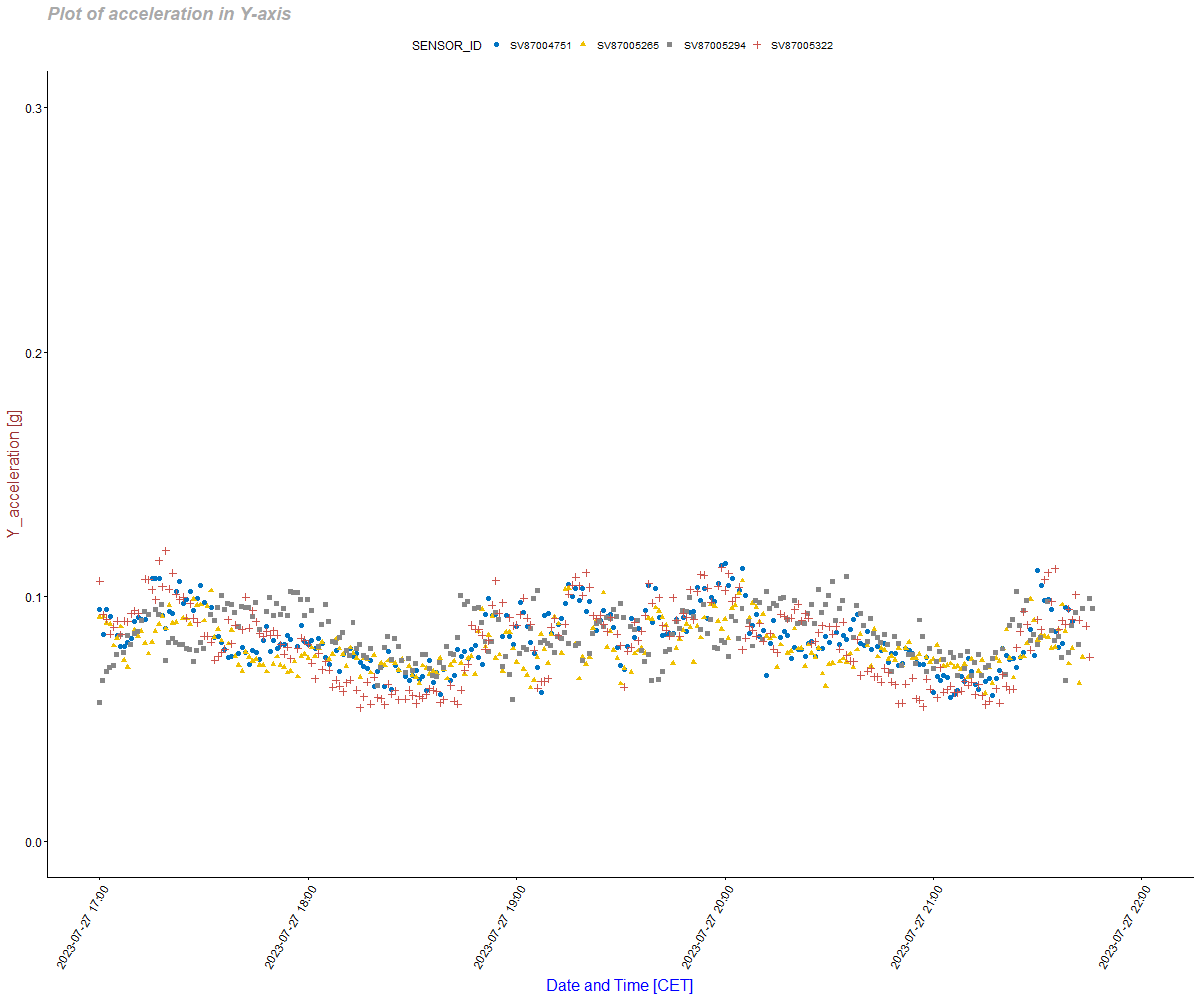
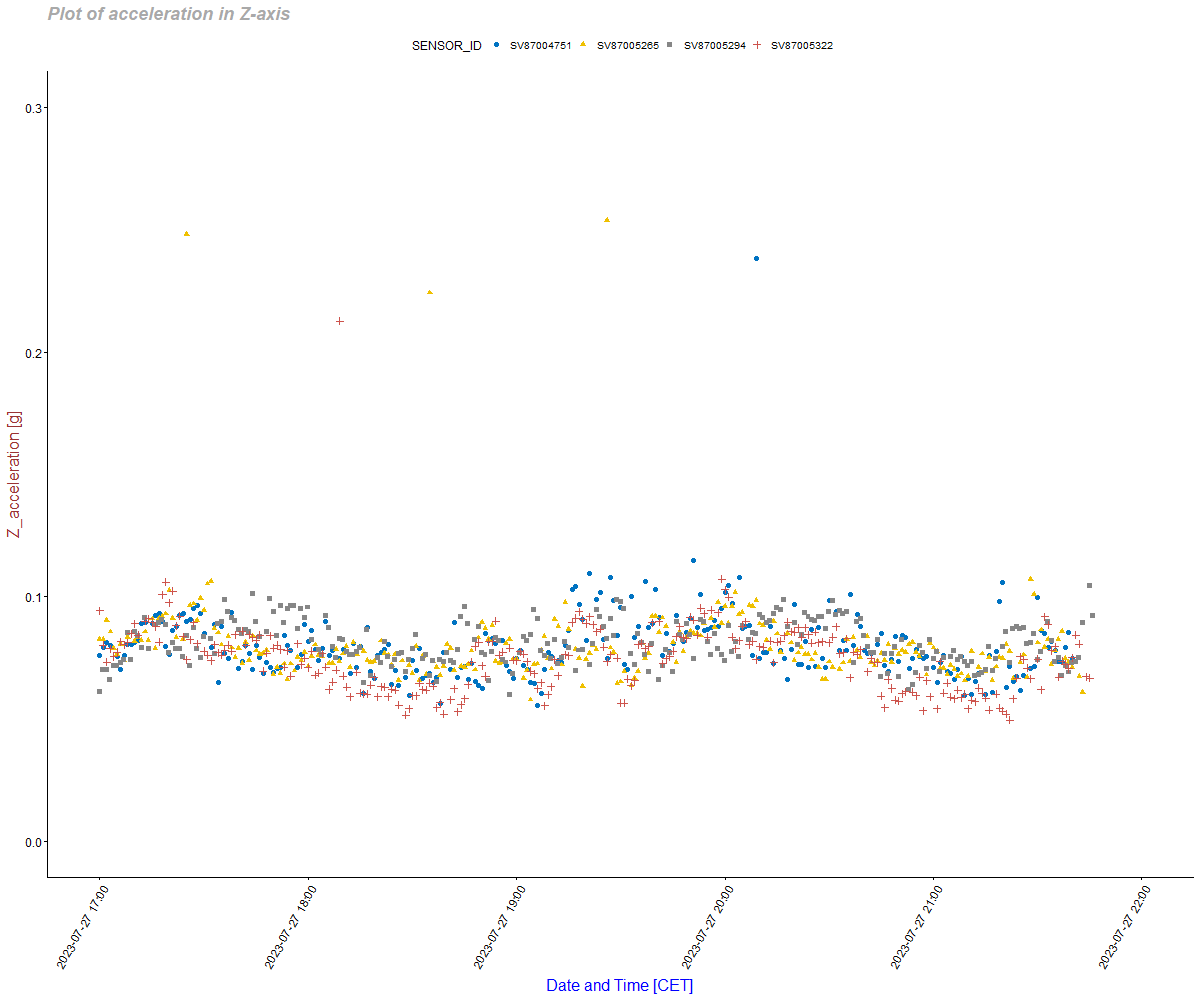
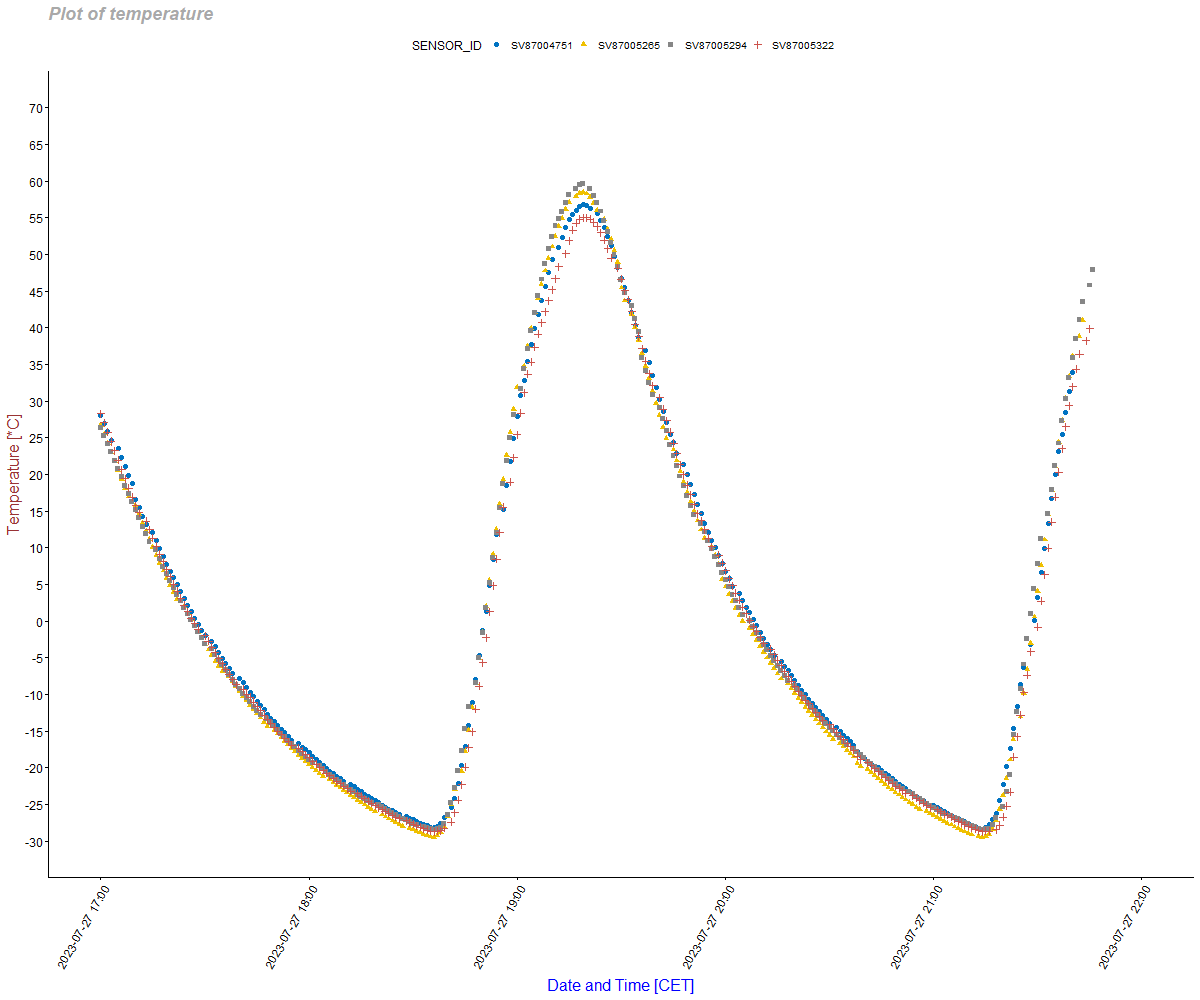
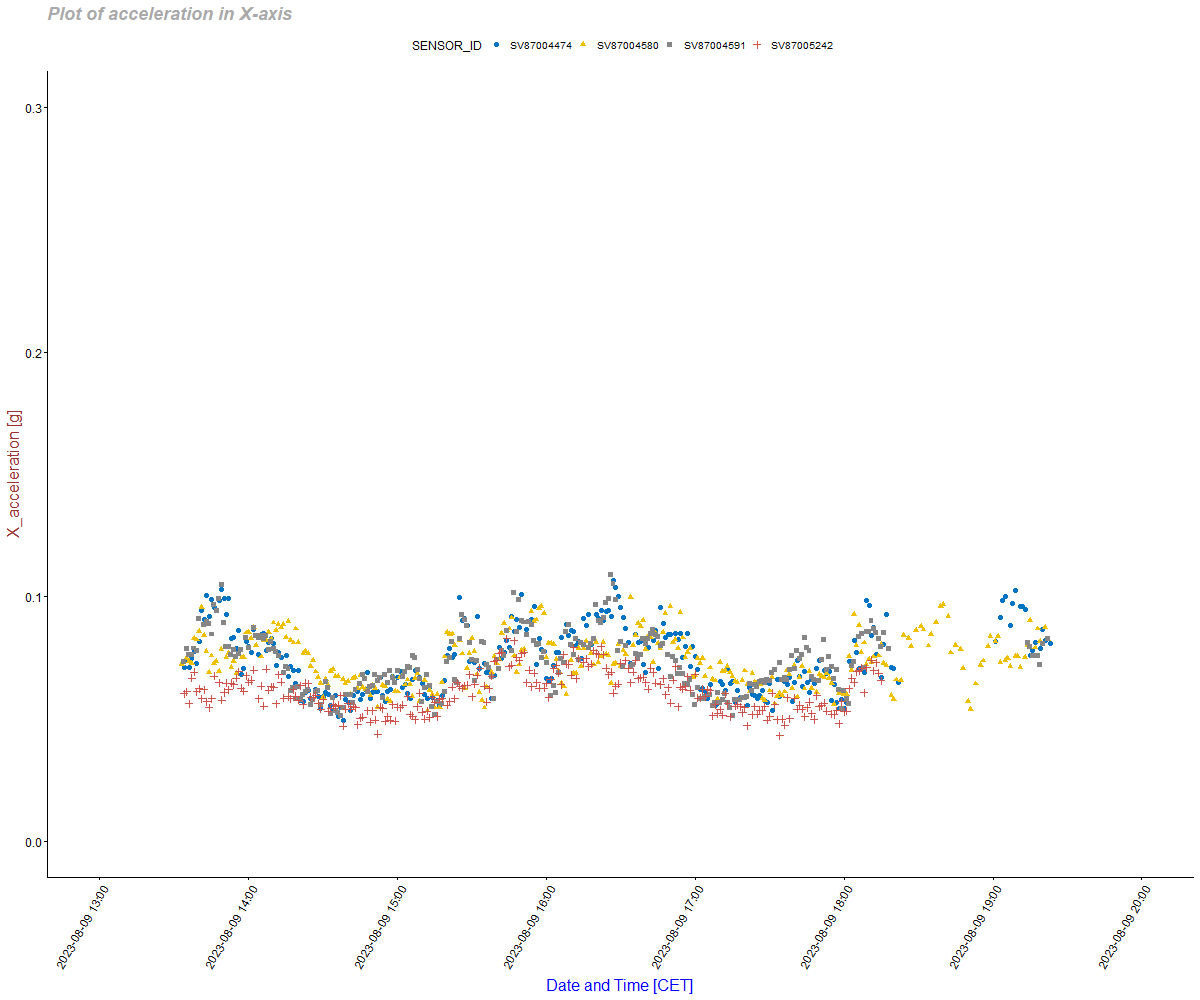
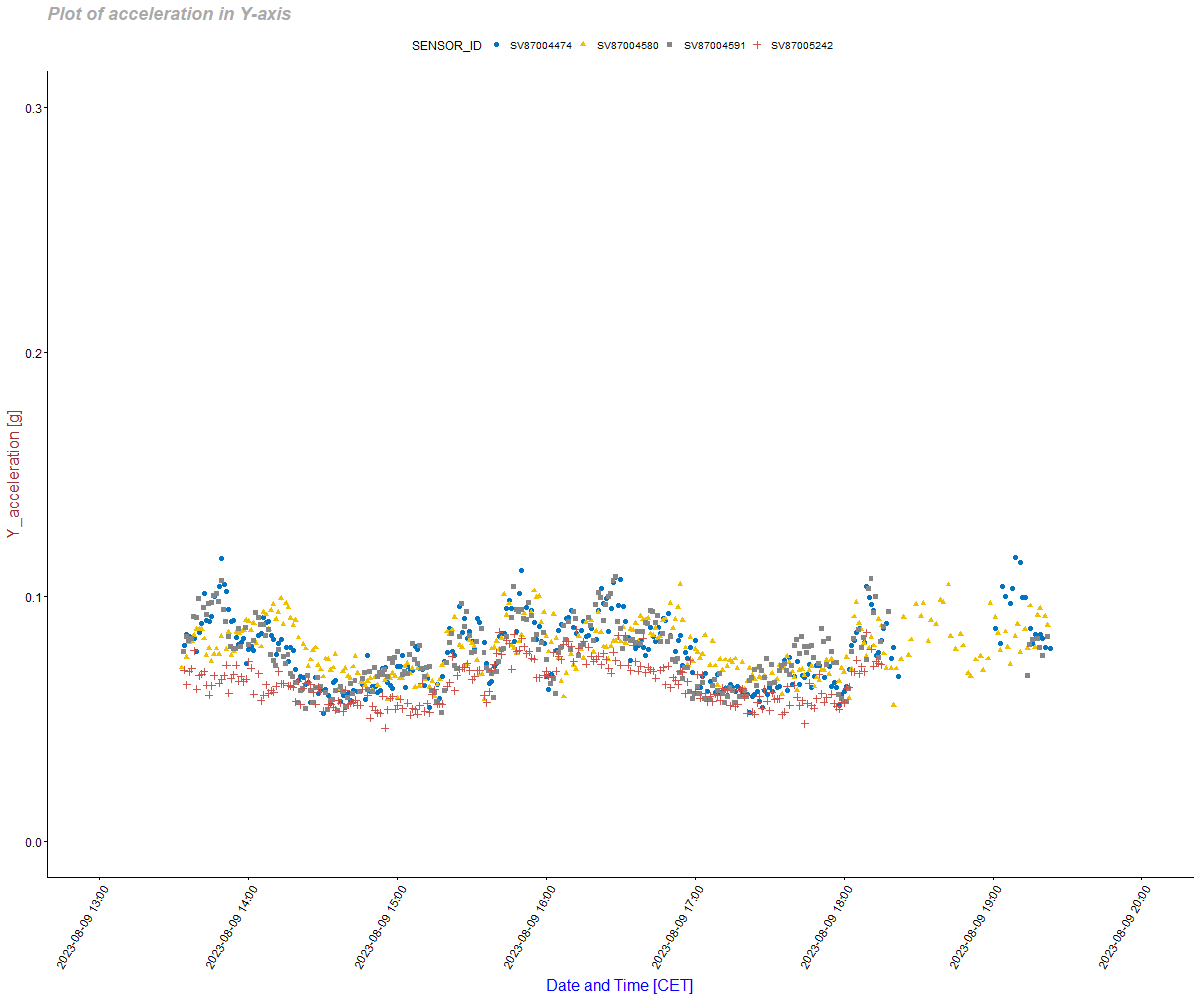
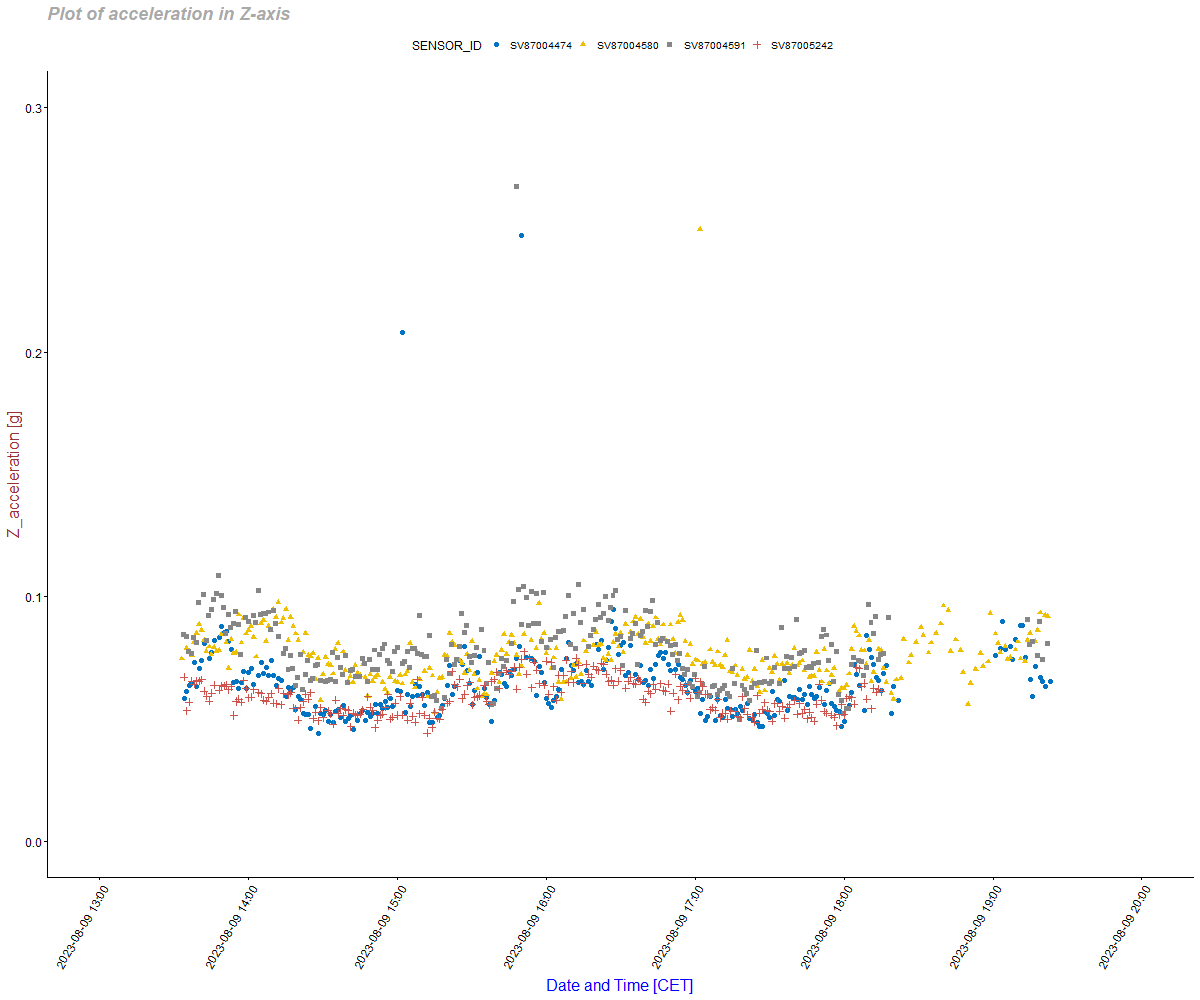
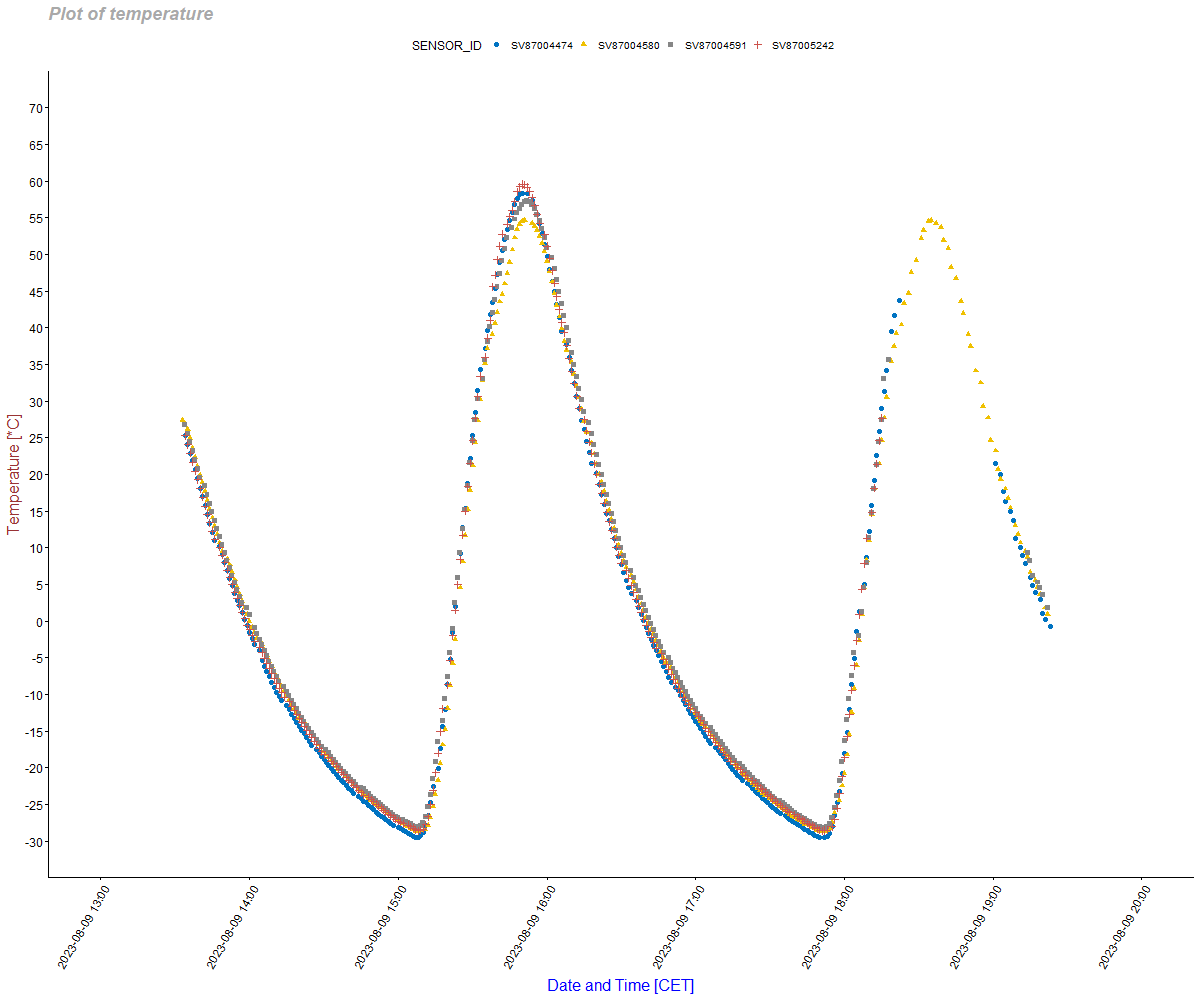
4 plots of data taken by the 3-axis vibration and temperature sensors mounted on top of PCC cards:
Initial 4 sensors did not last even 3 thermal cycles in the chamber. They were replaced with a new set of 4 sensors, that again failed after 2 thermal cycles. The sensors are rated from -30 to +80 deg. C, the failures were communicated to the producer as a reclamation case.
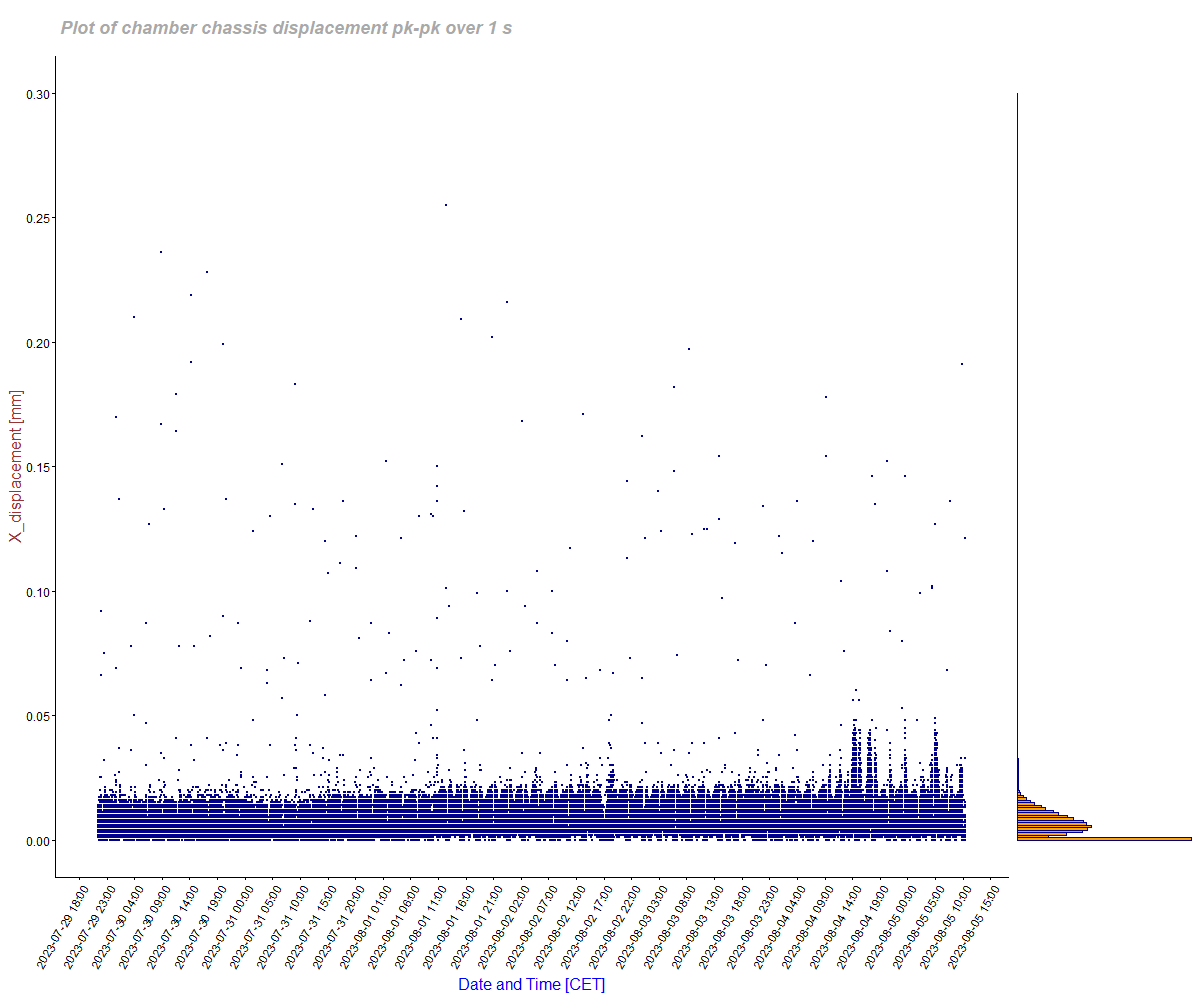
Additionally an external single axis vibration sensor has been mounted on the chassis of the chamber to measure its vibrations in terms of amplitude of displacement, vibration speed and vibration acceleration expressed in two units [g and m/s^2].
Displacement plot - full data:
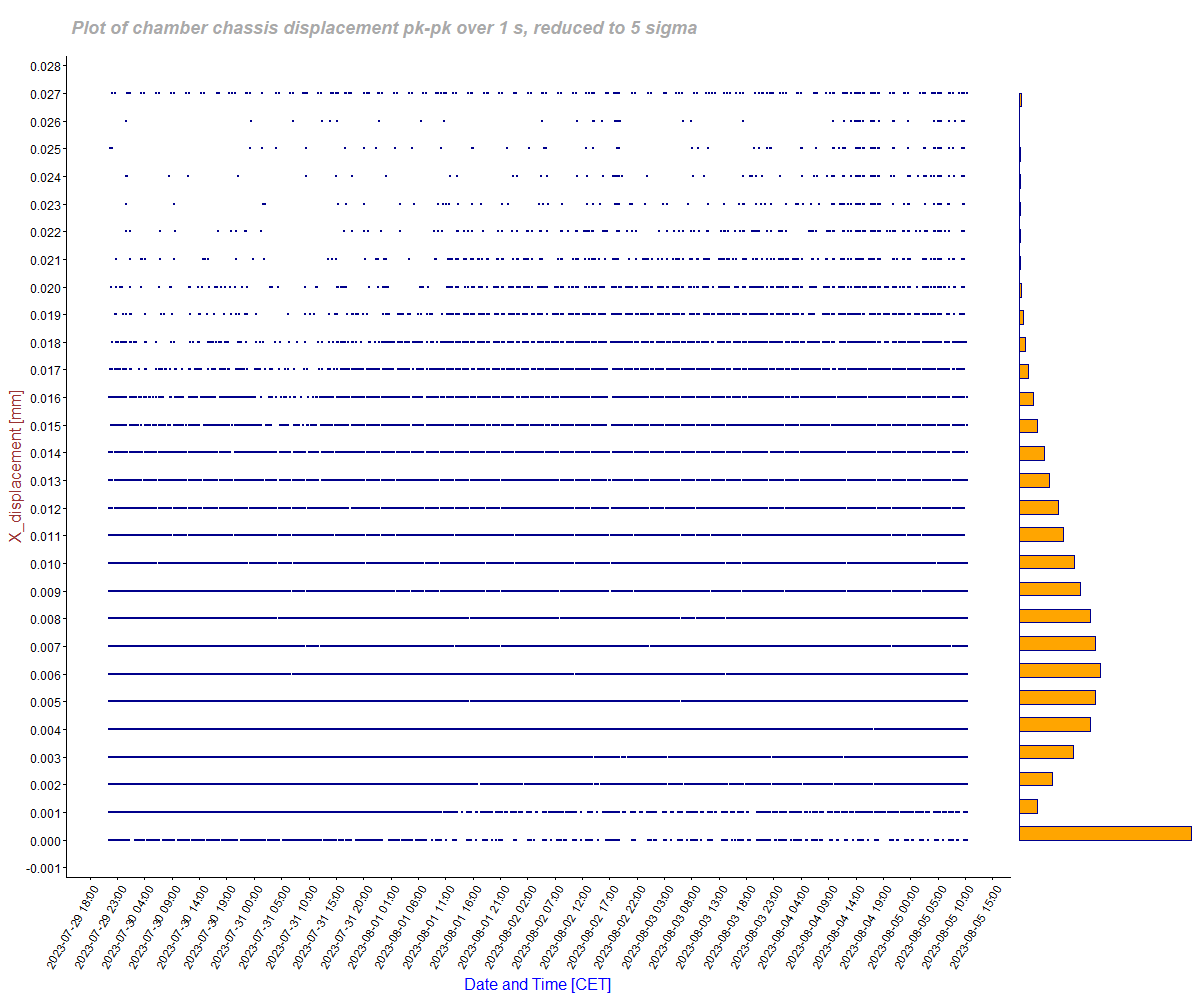
Displacement plot reduced to 5 sigma, where points with values above 5 sigma are assigned with 5 sigma value.
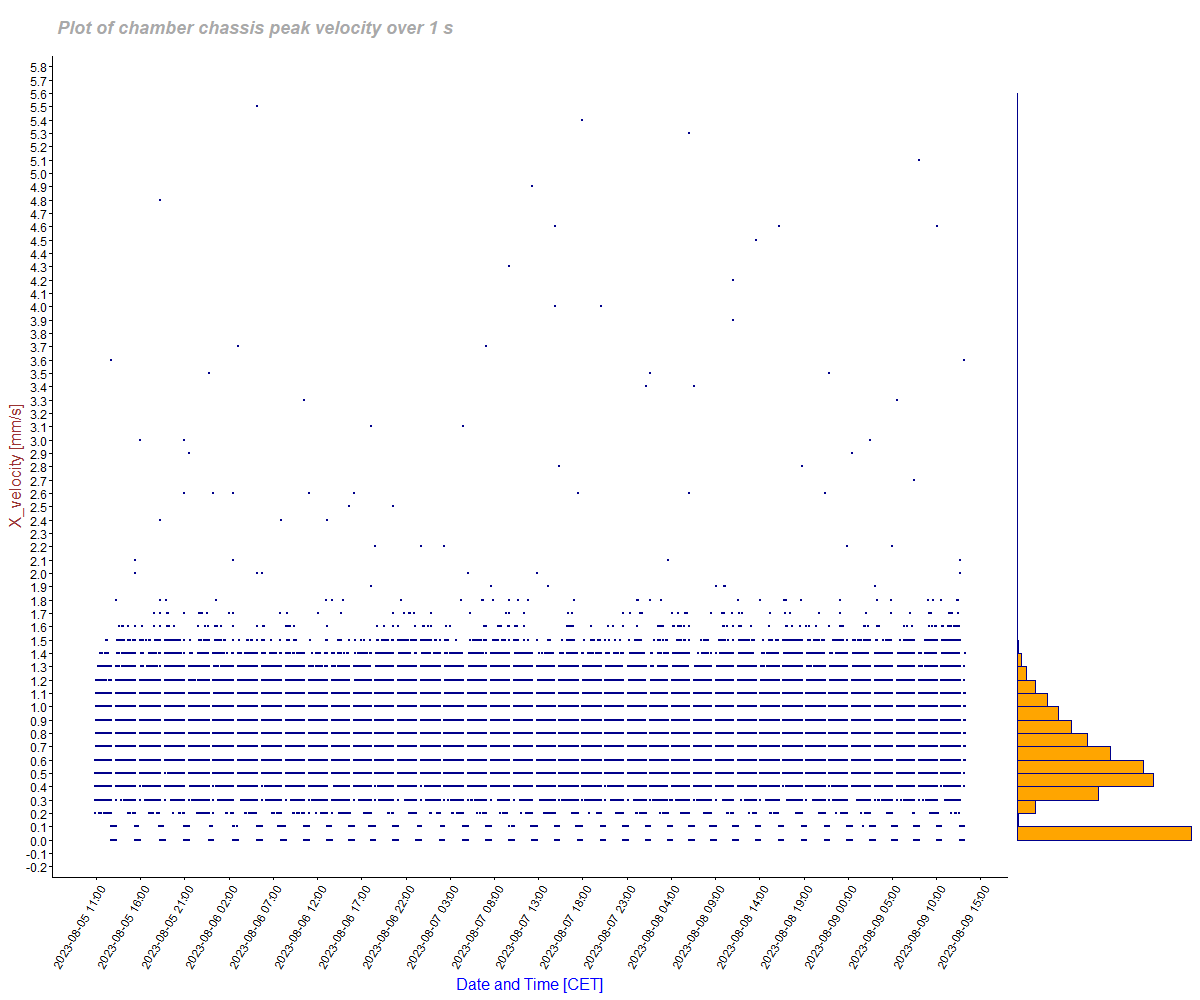
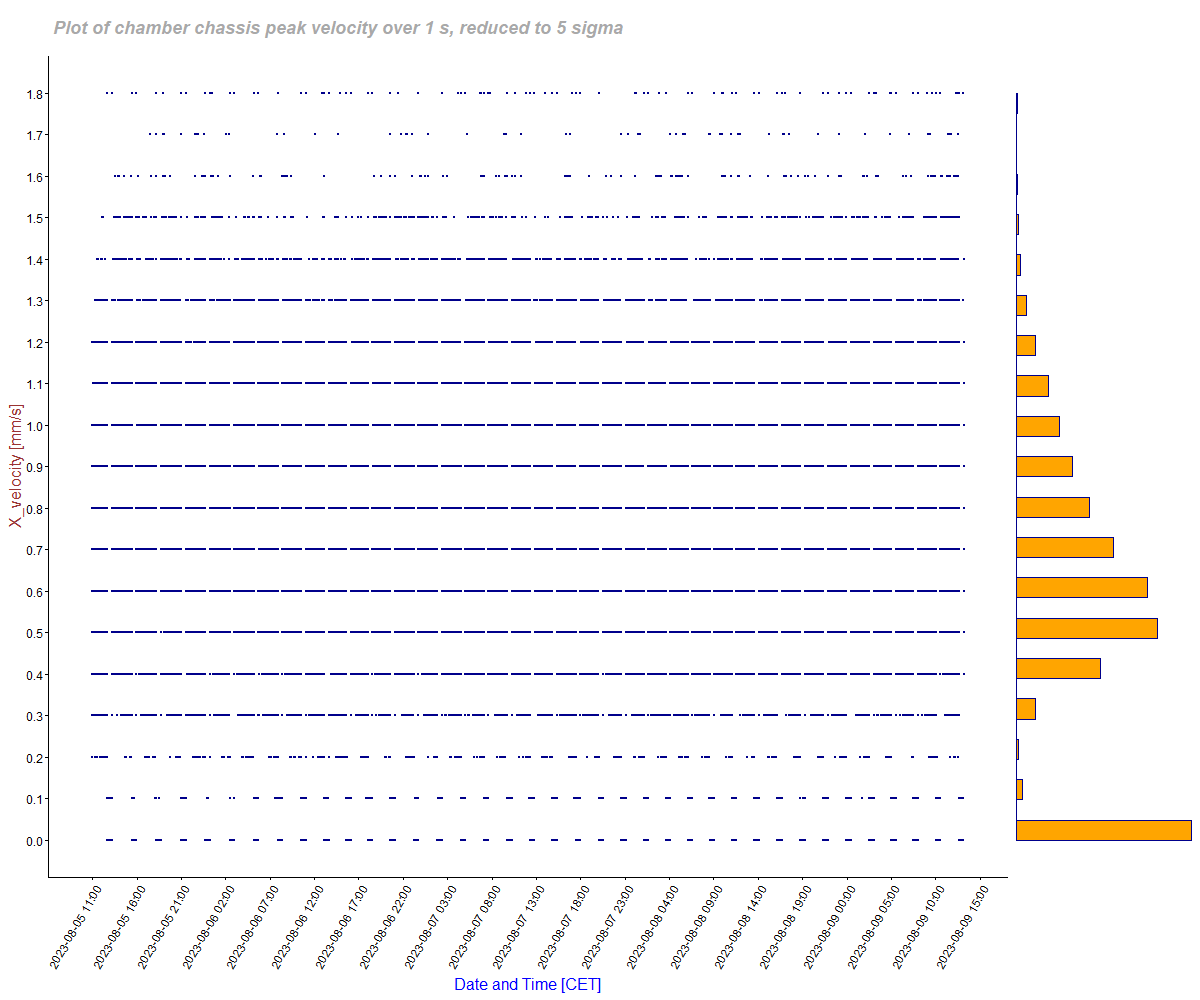
Velocity plot - full data:
Velocity plot reduced to 5 sigma, where points with values above 5 sigma are assigned with 5 sigma value.
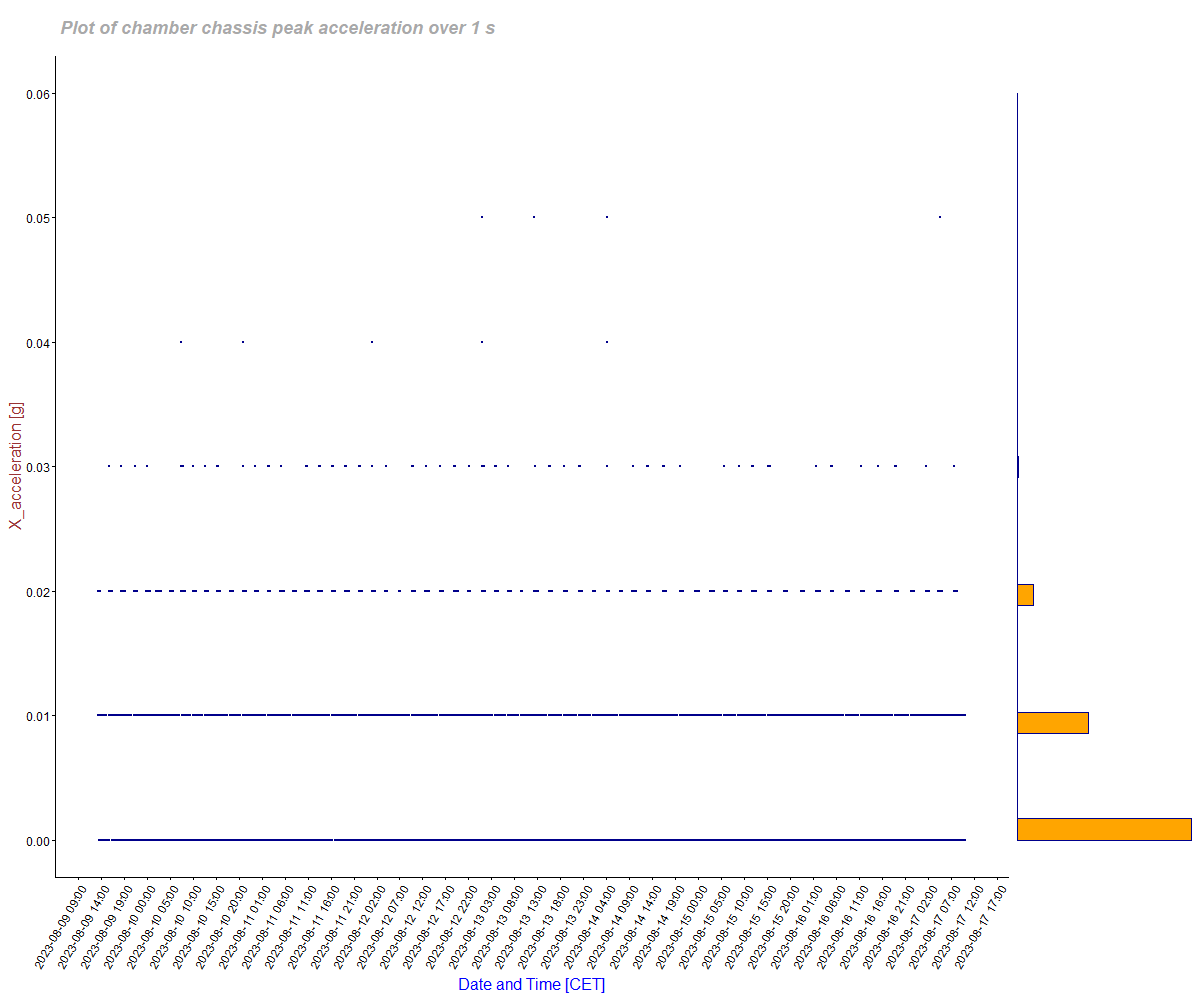
Acceleration plot in g unit - full data:
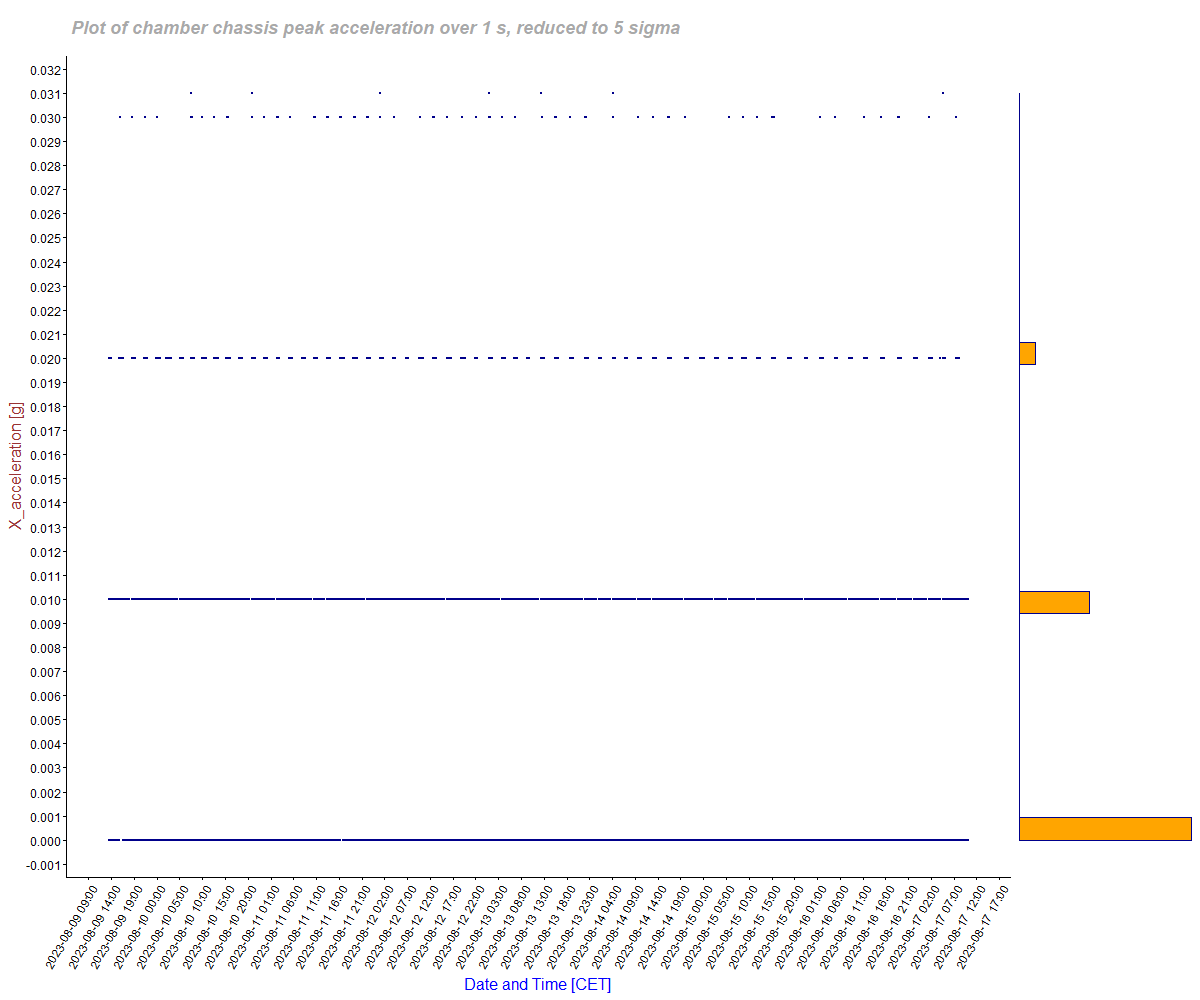
Acceleration plot reduced to 5 sigma, where points with values above 5 sigma are assigned with 5 sigma value.
Acceleration plot in Si unit - full data:
Acceleration plot reduced to 5 sigma, where points with values above 5 sigma are assigned with 5 sigma value.